Updated January 2026
Quick summary
Google Analytics 4 (GA4) is the latest version of Google’s free website analytics tool that helps you track and understand how people interact with your site; this beginner’s guide explains why it’s important for SEO, how to install it, and how to use its reports on things like visitor sources, engagement, and events so you can make smarter data-driven decisions about your content and marketing.
2026 Update
Google Analytics 4 (GA4) is Google’s standard analytics platform. It helps you understand how people find your website, what they do once they arrive, and which pages or actions lead to enquiries or sales.
What GA4 tracks and why it feels different
GA4 is event-based. Instead of focusing mainly on sessions and pageviews, it records interactions as events. This includes page views, scrolling, outbound link clicks, file downloads, video engagement, and form interactions. The event model makes GA4 more flexible, but it can feel unfamiliar at first.
The main reports you will actually use
- Realtime: See what is happening on your site right now.
- Acquisition: See where traffic is coming from (Google, social media, referrals, email).
- Engagement: See which pages people view and how long they stay engaged.
- Conversions: Track the actions that matter to your business, such as enquiries, bookings, purchases, or newsletter signups.
How to install GA4 in 2026
You can add GA4 in a few ways. The best option depends on your platform and how much control you want over tracking.
- Direct install: Add the GA4 tag to your website settings or theme, often through your platform’s integration field.
- Google Tag Manager: A flexible option that lets you manage GA4 and other tracking tags without editing your site code every time.
- Plugin or integration: Popular for WordPress, where a trusted plugin can handle setup and keep things tidy.
Set up conversions early
GA4 is most useful when you tell it what success looks like. Set up conversions for the actions you care about, such as contact form submissions, phone number clicks, quote requests, bookings, or purchases. Many events can be tracked automatically, and you can mark the most important ones as conversions inside GA4.
Make sure your data is clean and accurate
- Exclude internal traffic where possible so your own visits do not distort your data.
- Check that key events are firing correctly using Realtime and Debug tools.
- Keep your tracking consistent across your whole site, including landing pages and thank-you pages.
Privacy and consent still matter
If your website serves users in the UK or EU, you may need a consent banner and a setup that respects consent choices. Many businesses configure GA4 so it only loads certain tracking once consent is given. This helps you stay aligned with privacy expectations while still getting useful insights.
What to focus on as a beginner
Do not try to track everything on day one. Start simple: check where traffic comes from, which pages perform best, and which actions lead to enquiries or sales. Once those basics are working, you can add more tracking as your website and marketing grow.
If you’re interested in SEO, Google Analytics is one of the first things you will add to your website after it’s gone live.
There’s also the Google Search Console which any good SEO expert swears by, but the two things are fundamentally different:
- Google Analytics collects information about the users visiting your website
- Google Search Console shows you how well your website is already performing in the Google search.
Think of it this way: Google “Search” Console is all about search results, but analytics is all about people.
Both tools are super helpful for improving your SEO. In this guide, we will stick to Google Analytics (Version 4). I will also give you a nifty little tool so you can show your Google Analytics data in a dashboard – completely for free!
Google Analytics collects information about the users visiting your website
Why is Google Analytics important for Search Engine Optimisation?
Google Analytics provides a lot of information about the people visiting your website, such as:
- Time of day they visit
- Day of the week
- How long they stay on your website
- How many pages they look at
- What path they follow when looking at your website
- Where they came from (e.g. social media, an email link, Google search etc.)
- What device they used to look at your website
- Which pages your visitors don’t like on your website
- Which pages your visitors keep coming back to
- And so much more!
By knowing the answers to the above examples, you can easily build a to-do list and improve your website so that your Google Analytics data improves.
More website traffic does not fix an enquiry or sales problem!
Why more website traffic is not the best goal
Many small business owners are obsessed with getting more website visitors. Generally speaking, more visitors equals more potential leads equals more potential sales.
But let’s look at conversion rates real quick (promise, not geeky!!).
One of my websites (the wedding photography one) gets over 2,000 visitors a month (and I don’t even do wedding photography anymore!). There’s a section on this website about secret proposal photography. This part of my website attracts on average 120 visitors per month. The rest of the visitors use my blog to get answers to their wedding questions.
Let’s stick with the secret proposal photography section.
- This section of my website attracts 120 visitors a month (all from Google)
- From those, I get 10-15 enquiries per month (I have now actually removed the enquiry form as I can no longer take bookings)
The conversion rate is super high, so how did I achieve this?
The goal was not to get more visitors, but to convert more visitors into enquiries from the ones already visiting my website.
So if you get no enquiries from 100 visitors a month, why should you suddenly get enquiries if you get 1000 visitors a month?
Here’s how Google Analytics can help you find the pages on your website that simply don’t give the visitor what they were looking for!
The goal is to get enquiries from your existing visitor numbers and then you can focus on getting more website visitors!
If you get no enquiries from 100 visitors a month, why should you suddenly get enquiries if you get 1000 visitors a month?
What is Google Analytics and how do I install it on my website?
Google Analytics is free software provided by Google providing you with lots of information that can help you make better digital marketing decisions.
You need to do two things:
- Creating a Google Analytics account
- Installing the tracking code on your website
Installation on your website is super easy. Depending on the platform you use (for example WordPress, Squarespace, Wix etc.), there are different ways to connect your website with Google Analytics.
Also bear in mind – if you are in a country with super tight GDPR restrictions (Germany for example), you may not be able to use Google Analytics on your website!
So here’s how to install it – You need a free ChatGPT account for this!
Simply click on this button and only enter your platform name in the chat field (such as WordPress, Shopify, Wix, Squarespace etc.) in ChatGPT – this will then magically show you how to install it for your platform.

Show me the magic GPT
1️⃣ Make sure you're logged into your ChatGPT account. 2️⃣ Click on the cat. 3️⃣ Enter your platform name into the chat field and hit Enter 😻
For WordPress, it’s super easy. All you need is the Google Analytics Plugin and you need to enter a simple code. This all takes 2 minutes and you’re up and running. The plugin I’ve used successfully is called GA Google Analytics by Jeff Starr.
I’ve installed Google Analytics, but there’s no data?
If you’ve only just installed Google Analytics, there won’t be any data for you to look at yet. So wait a couple of weeks and then access Google Analytics.
However, if you’ve had Google Analytics installed for a while and there’s no data, then there’s a connection problem.
Simply grab the installation code (either the tag or the manual code) and re-install it on your website again.
Watch this video I recorded which tells you where to find the Google Analytics 4 Embed Code for your website.
Rule of thumb: Data that’s easy to find won’t be very useful for SEO!
Knowing how many visitors were on your website last month won’t tell you what to do. It’s good to keep an eye on this, but don’t get obsessed with checking this number.
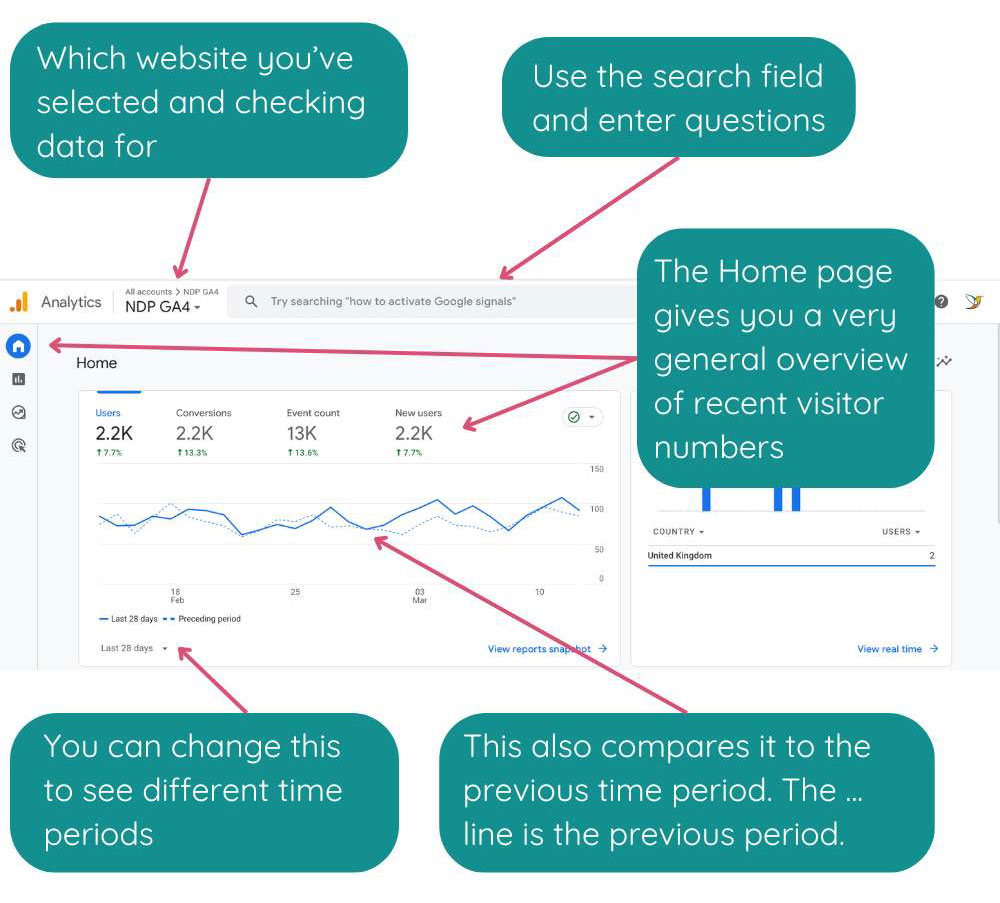
How to use the search field in Google Analytics 4
The search field is a great addition helping you to find common reports really quickly. As soon as you click into the field, Google suggests a couple of questions and then also encourages you to check out more suggestions.
It’s worthwhile exploring these and checking common reports regularly.

Click on the search suggestions (questions) and you will get mini reports just with 1 click.
How to use the Reports tab in Google Analytics 4
The next tab below the Home page is the reports tab. This provides a wealth of information about your website visitors. Click on the sub headlines (i.e. Acquisition, Engagement etc.) to see the reports for each section.
What does Acquisition mean in Google Analytics 4?
This section tells you everything about where your users come from.
The Overview page shows some general reports, for example if people visited your website from Google or Social Media.
Check out the screenshot below⬇️.
When you click on User Acquisition, it gives you more details about the user engagement relating to the different sources of your visitors.
In the below example, you can see that people who visited my website from Google (Organic Search) spend way more time on my website (53 seconds) than those who come in from Organic Social (only 19 seconds).
It also shows that the Engagement Rate is very high amongst visitors from Organic Search (those who found the site in Google), in comparison to Organic Social.
Generally speaking, an engagement rate above 60% is considered good!
How can I use Google Analytics 4 Acquisition Information for SEO?
- Your engagement rate is below 50%:
- Add more helpful content to your website.
- Add CTAs (Calls to Action) on every page, either to read another page or fill in a form, subscribe, download etc.
- Add videos which keeps users engaged for longer.
- Your Average Engagement Time is under 40 seconds:
- Add more useful content to your website so people actually have something to “consume”.
- Adding videos and interactive elements such as quizzes or calculators can keep your visitors on your website for longer.
- Your Engagement Rate for Organic Social is dramatically different for Organic Search:
- This means there is a mismatch of target customer and your content.
- You may communicate on Social Media that you’re a super busy XYZ and when people click on your website, it looks unprofessional and they won’t spend any time there. Or your website has content that is hard to read – so they click away quickly.
How to use the Events Tab so that Google Analytics can track your enquiries
Google Analytics allows you to set up “Events” which can then be tracked. An “event” is for example:
- Someone buys something
- Someone downloads something
- Someone sends you an enquiry
- Someone ready a blog post
You can set up many different event types, but for simplicity, let’s stick with these.
How to set up an event to track website enquiries in Google Analytics 4
The first thing you need to do is set up a Thank-You page on your website that is displayed after someone sent you an enquiry. Once this is set up, do this:
- In GA, Click on Admin > Data Display > Events
- Click on Create Event
- Click on Create
- Give your event a name (this must start with a letter and can only include letters, numbers and underscores, for example: “website_enquiry”)
- Then add this first condition:
- Parameter: page_location
- Operator: contains
- Value: https://mysite.com/the-url-of-your-thank-you-page
- (for the value, you need to enter the full page address of your thank-you page)
- Now add this second condition:
- Parameter: event_name
- Operator: equals
- Value: page_view
- Click the blue CREATE button top right. Done!
This is now ready to track your enquiries in Google Analytics. How cool is that?
Your event is then displayed on your Engagement > Events tab.
How to use the Engagement > Pages & Screens data for your SEO
The next sub headline “Engagement” is super cool! It gives you SO much information and should spur you into making changes on your website.
Especially the Pages and Screens section contains so much information.
Just the overview page already provides information about which pages on your website are good and which need work.
- Top left – change this to “Page title and screen class” so that you can see your page titles easily.
- You can sort the table by all columns simply by clicking on the column (for example click on “Views”). If you click once, it will sort it one way, if you click on the column heading again, it will sort it the other way (descending / ascending).
- Look at the table and see what are your most popular pages (i.e. which ones get the most views.
- Sort by views and find out which pages are not performing (i.e. not many views).
- Check the engagement time and if it’s very low, then increase the content on the page in question.
How to use the Search field above the table under Pages and Screens in Google Analytics 4
If you offer different services or products, you could simply enter a single keyword into the search field.
In the below example, I entered the word “proposal” into the search field, filtering all my pages and posts and only showing those with the word “proposal” in the URL or page title.
This gives me information about the proposal pages on my website, how many people visited them, how much time they spent on them and which ones I should improve.
What does Landing Page tell me in Google Analytics 4?
This is an interesting tab as this tells you which page was the first page visitors visited on your website.
As you can see from this screenshot, it’s not the homepage! (The homepage is the one with the “/”).
That’s one of the reasons you shouldn’t use the word “welcome” on your homepage, as it’s often unlikely that this is the first page people see when visiting your website!
As you can see in the screenshot below, the homepage is the 3rd most visited page on the website. The most visited one is the one about wedding family photos. This blog post receives almost 4 times as many visitors as the homepage.
If you have a good blog section on your website, it’s likely that some of your blog post are read A LOT.
What should I do with the landing page data for my SEO?
As you can see in the example, people are asking the question in Google about the standard family photos at a wedding. I could expand on this, add CTAs (Calls to Action) and offer a download to engage people further in the content. This blog post attracts a lot of visitors, so I can now shape it to provide more information to them.
How Google Analytics 4 user data can help you improve your website
The last section to look at for this blog post is the User section. If you click on User > User Attributes > Overview, you will find out where the majority of your website visitors come from. If your business is in the UK and you are targeting potential customers in the UK, but a huge number of visitors comes from a country in Asia, it might be that your website is getting spammed.
There are options to exclude certain countries from visiting your website and you may want to speak to your web hosting company or platform provider. For WordPress, there’s a plugin called “Limit Login Attempts”. The pro version allows you to prevent certain countries from visiting your website.
Be careful though as some services you may use on your website (such as Stripe) is operated out of the US, so don’t remove country access where it’s needed.
How to use Audiences in Google Analytics 4
The User > User Attributes > Audience section is another cool part of Google Analytics 4. Similar to events, you can set up separate audiences in the Admin section of your GA4 account.
Why would you need to set up Audiences?
For example, if you’re a cake designer, and you sell wedding cakes, birthday cakes and cake making classes. Every single one of those has its own audience.
You should have different content sections on your website that provide information for each. People who search in Google for cake making classes in a certain part of the UK are not interested in learning about wedding cakes.
You don’t need two or three different websites, you simply provide content for each section on your website! Remember – Google ranks web pages, not websites!
How to set up an Audience in Google Analytics 4?
- In GA4, click on Admin > Data Display > Audiences.
- Click on the blue button “New audience”. Then click on “Create Custom Audience”.
- Give it a name
- You can add a short description if you like.
- I called the audience “Organic / Proposal” (meaning all visitors that found the website in Google organically and searched for Proposal related content)
- The first condition I used:
- Included users when:
- First user source: contians Google at any point in time
- The second condition I used:
- Include sequence:
- Step 1: Page location
- contains Proposal
(see screenshot below).
I can now easily find out how many people visited my website – specifically the proposal pages – and found me in Google.
What do I do with this information? I can set myself targets, for example to get more visitors from Google by improving my website content on the specific pages.
The things you measure can be improved!
In this blog post, I only scratched the surface of the amount of information Google Analytics 4 can provide.
Bigger companies with tens or hundreds of thousands of monthly website visitors will digg much deeper and gain more insights which then helps them to improve their website and ultimately get more enquiries or sales.
If you’re only starting out in your SEO journey, don’t get too overwhelmend.
Even with the simple set up of events and audiences, you will get much deeper insights than just looking at the number of visitors you have every month.


